Inspired by
The creation of this simulation model was triggered or should I say inspired by an article in the Dutch daily paper NRC.Next of March 23, 2020.
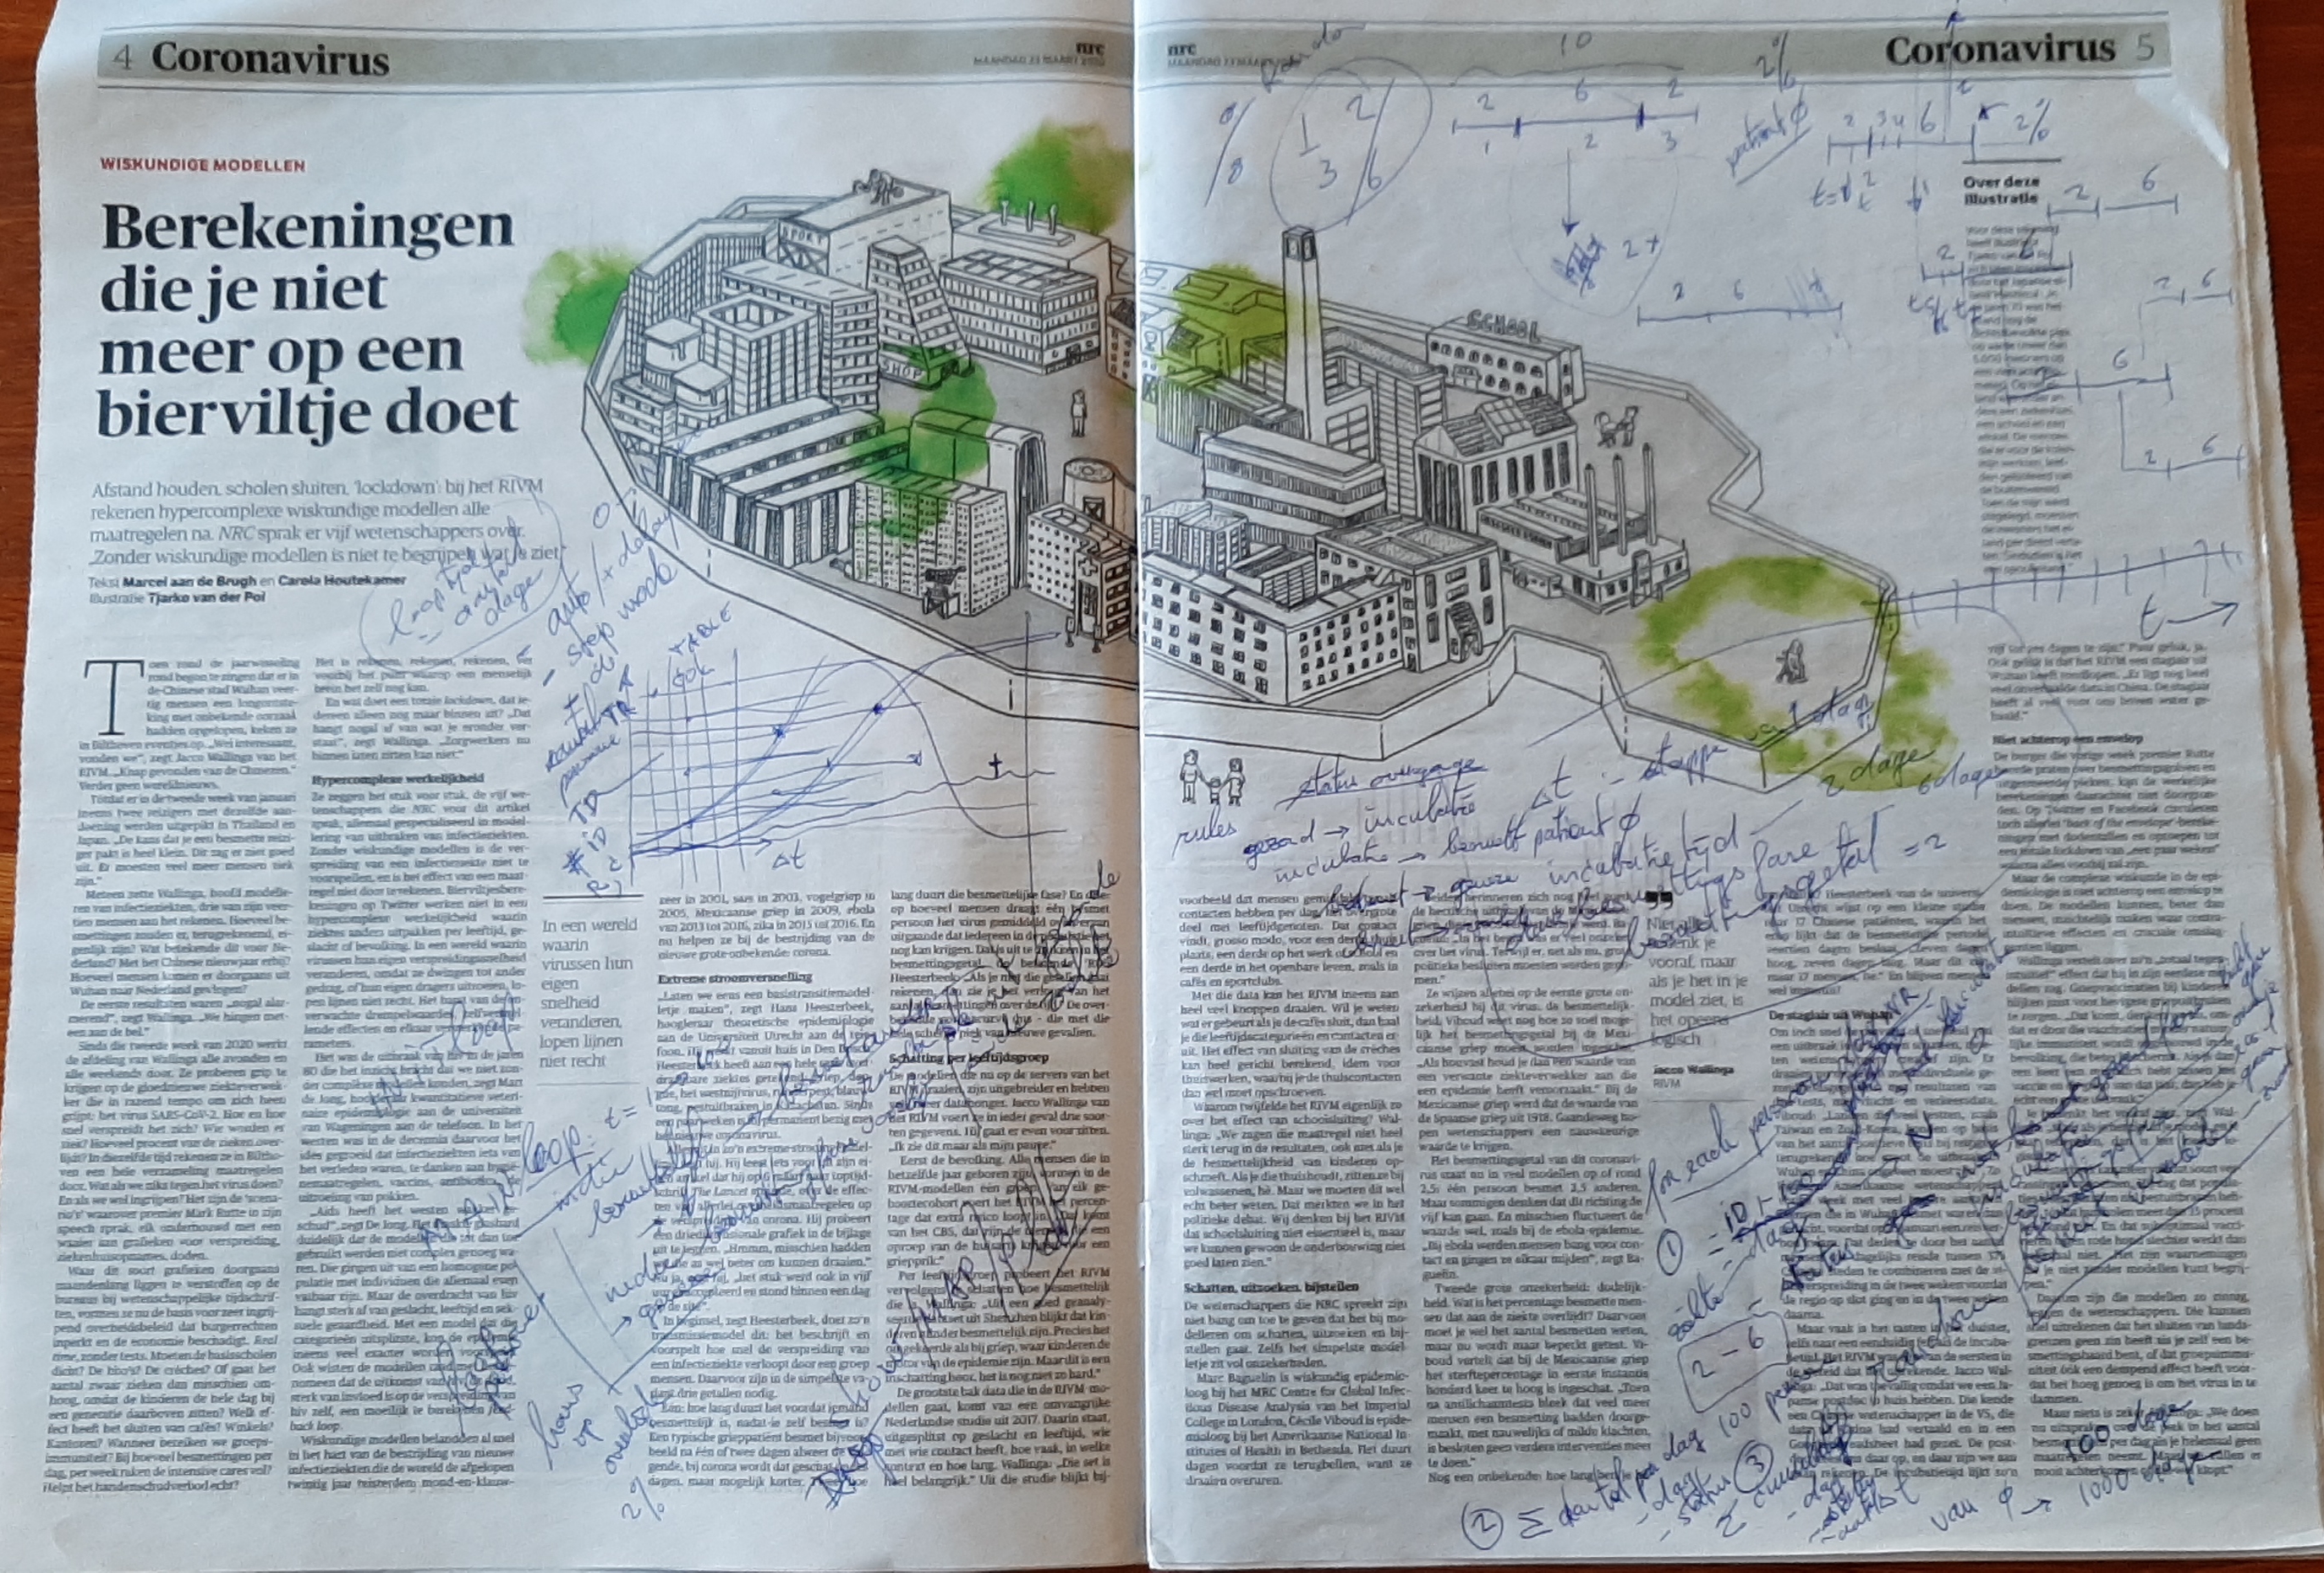
The full article can be viewed at Waarom bierviltjesberekeningen over het virus niet werken.
See the photo below with my inspirational scribbles ;-)
How the model works
The model is a very simple one. It simulates the spread of a contagious disease. The behaviour of the model is described below.
In the beginning there is a patient 0. Somehow this individual has been infected with the disease.
It takes some days during, i.e. the incubation period, before this individual will become contagious.
During the contamination period this patient 0 can contamine other still healthy individuals.
The newly contaminated individual can, after some incubation time, also contaminate other healthy individuals.
This contamination goes on and on until all individuals have been contaminated or the disease has stopped to contaminate others.
Patient 0, like any other contaminated individual, will recover after some time. There is small chance that the disease will kill a contaminated individual.
Parameters
To simulate the spread of the disease, the model uses parameters.
These parameters influence the behaviour the way the disease spreads.
To limit the amount of calculations required the parameters are limited within certain ranges.
| Parameter | Default | Valid range | Meaning |
| Population size | 50 | 10 - 100 | Number of individuals in population. |
| Duration | 40 | 10 - 90 | Time in days to run the simulation. |
| Incubation period | 2 | 0 - 14 | Days before an infected individual becomes contagious. |
| Contamination period | 6 | 1 - 21 | Days an individual stays contagious.
During this period this individual can infect other healthy individuals. |
| Contamination number | 3 | 0 - 10 | Number of healthy individuals a contagious individual can infect.
A value 0 means the disease is not contagious.
Values between 0 and 1 means the disease will cease to spread.
Values above 1 will spread the disease exponentially. |
| Risk of death (%) | 2 | 0 - 100 | Percentage representing the possibility a contaminated individual will decease. |
| Social Distancing (%) | 0 | 0 - 100 | Percentage of keeping distance between individuals.
0 is no distance and will help to spread the disease.
100 is max distance meaning everybody is in quarantine. |
Each of these parameters can be manually modified and twisted.
The graph
The results of the simulation run are shown in the graph area. On the horizontal axis the days are plotted, i.e. the progress of time.
The vertical axis show the population where as each line represents a single individual.
The different colors during the timeline show the status of the individual.
These statuses can be healthy, infected, contagious, recovered or deceased.
The legend show the colors belonging to each status.
Most individuals will recover from the contamination, a few will perish and the lucky ones are not touched by the disease at all and will stay healthy all the time.
A few tips
The model uses default values for the parameters. If you want the disease spread much quicker, then increase the Contamination number. Just set it to say 6 or 7 and leave all other parameters untouched.
Run the model and you will see the disease spreads much more quickly.
If you like to apply a kind of "lock down", i.e. almost everybody in quarantine at home so the infection rate will decrease, then set the Social Distance percentage to 67 and Run the model again. Observe what happens.
The model uses some randomly applied logic. Running the model several times with the same parameter values will more or less give the same results.
Once a while it can happen that the only contaminated individual is patient 0 and no others will be infected.
The model performs a large number of iterations to simulate the spread of the disease. Because this is only a very simple model the amount of iterations is limited.
Maximum iterations is limited by the calculation below:
population size multiplied by the duration in days is maximized to 9000
Note: When running the simulation repeatedly with a large population and/or for a long duration the model will consume many resource from your browser. So it can be useful to once a while refresh the browser tab to free resources.
Disclaimer
This very simple model is for fun only. It does not by any means represent a real situation nor can any conclusion nor any advise or what so ever taken from the results of this model and be applied in real situations.
Furthermore, if you like to copy the code of this application, be my guest and use and tweak it for your own purpose and fun.
If you have any ideas to enhance the code of this software or make the model more efficient, just let me know (you make me curious).
If after reading this you feel feverish or still have doubts about your own health, then please consult your doctor.
Take care, keep distance, stay healthy and have fun!